A friend and I were discussing October’s historically high fourteen pedestrian deaths in New Mexico, and the general rise in such fatalities here and nationwide. “Cheap gas,” was first proffered, along with the concomitant rise in vehicle miles traveled (VMT). Alcohol intoxication on the part of drivers and/or pedestrians was considered.
But a look into the numbers seems to indicate another factor. First, here’s the table of pedestrian and overall traffic fatalities compiled from UNM’s Traffic Research Unit reports:
NM Pedestrian Fatalities
2006: 70
2007: 52
2008: 40
2009: 41
2010: 34
2011: 36
2012: 58
2013: 55
2014: 73
2015: 55
First Ten Months of 2016: 66
NM Traffic Fatalities:
2006: 484
2007: 413
2008: 366
2009: 361
2010: 349
2011: 351
2012: 366
2013: 311
2014: 386
2015: 298
First Ten Months of 2016: 340
The downward trend of overall fatalities is explained by increases in vehicular safety equipment and a slowly falling rate of alcohol-related crashes. The pedestrian rate, 2015 interestingly notwithstanding, decouples strongly from this overall downward trend starting in 2012.
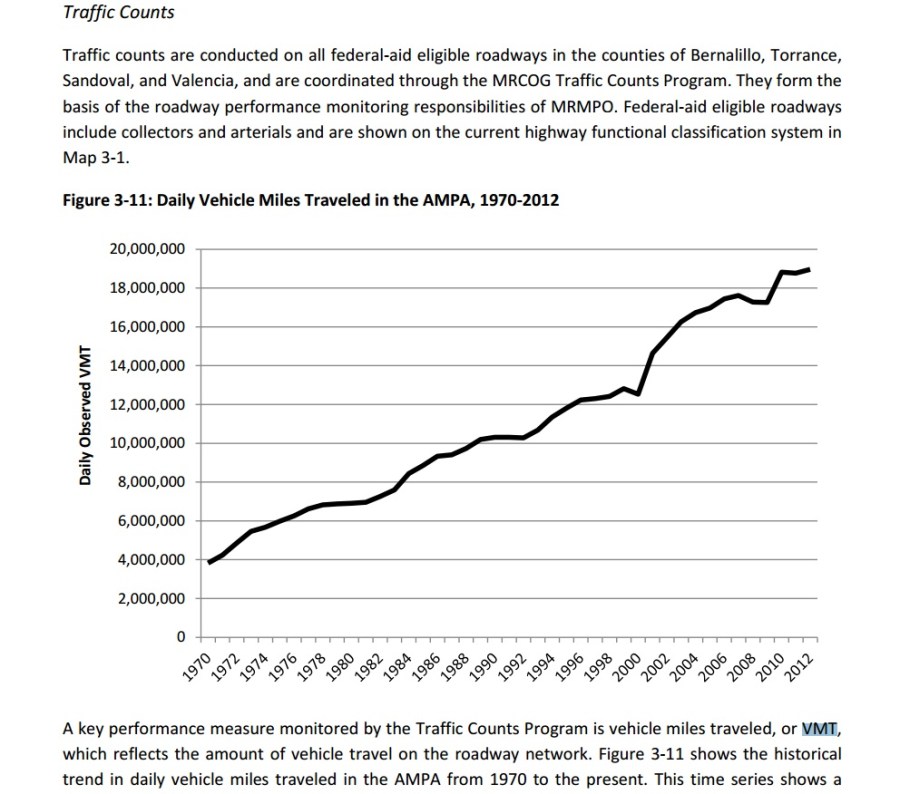
Now the graphs. First, let’s look at cheap gas and VMT. The closest/most recent we can come with such data only goes to 2014, but a look at the long-term trend of vehicle miles traveled compared with fatalities shows that the rise in VMT hasn’t historically equated with a rise in pedestrian deaths:
Here’s VMT in the four counties noted below from 1970-2012 from the Metropolitan Transportation Board’s long range 2040 plan (and a bit of explanatory verbiage):
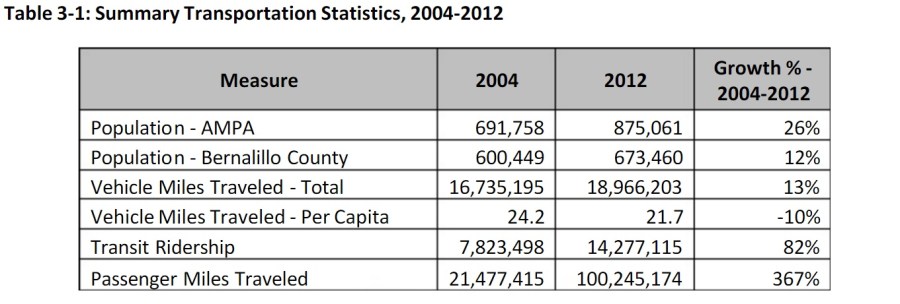
And here’s a look at 2004 v. 2012 VMT from the same document.
Again, we don’t have data, at least not yet, concerning 2013-present. Still, the correlation between VMT and pedestrian deaths isn’t there historically. What is showing a strong correlation, while we wait for more recent VMT data, is the arrival of the smartphone. Here’s a graph from Statista with numbers of smartphone users in the United States (sorry, no source, as BB doesn’t have a Statista account):
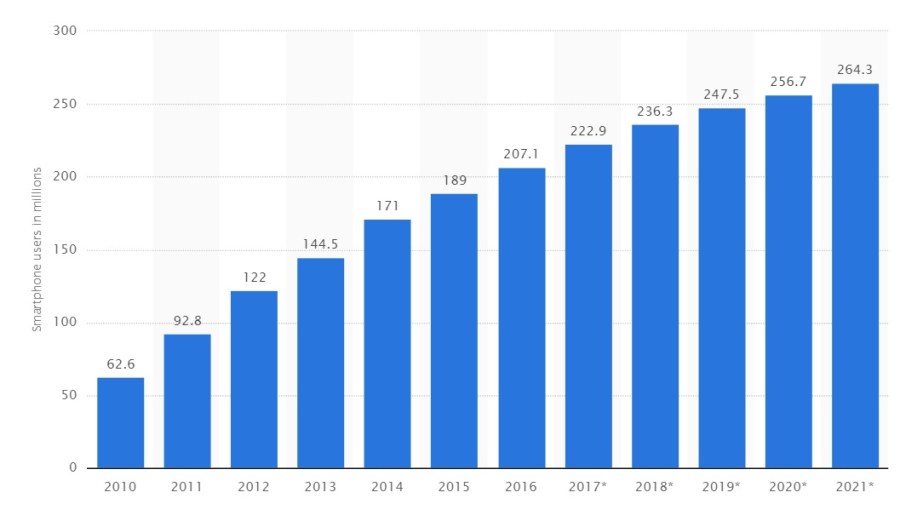
Much more data and analysis to collect, but an incomplete eyeballing of the above seems to indicate that smartphone usage, on the part of both drivers and pedestrians, is the leading causal factor in explaining this spike from 2012. Still, we’re quite some distance from being as confident as Hamlet was in telling his mom back in Elsinore, “Seems,” madam? Nay, it is; I know not “seems.”
We at BB will keep looking into this to hopefully get beyond “seems.” Strange that we should be using one of the most wishy-washy characters in all English literature as our basis of statistical confidence.
Have a good weekend, everybody.

What is passenger miles traveled, why did it quadruple in 8 years?
LikeLike
I thought you were going to ask me why there are only three graphs, instead of the announced four. A bit of a rush this morning before going out to look at Carlisle/Silver and such.
As for passenger miles, here’s the adjacent text explaining the 367% jump (spoiler alert: Rail Runner).
Not only are Albuquerque area residents utilizing transit more, the distances
transit users are traveling has increased dramatically, suggesting important shifts in the way people are
using transit. From 2004 to 2012, transit passenger miles traveled increased by 367 percent, one of the
highest rates of increase in the country.8 The biggest sources of new ridership and longer-distance trips
are the New Mexico Rail Runner Express, which carries approximately 4,000 passengers a day a distance
of more than 40 miles per trip, the introduction of the ABQ Ride Rapid Ride system, and policies to
provide free transit passes to UNM and CNM students, faculty, and staff.
LikeLike
Ah….
LikeLike
[…] never been higher for the National Bike Summit, coming up in two months in Washington, D.C. And Better Burque considers some of the data about why pedestrian deaths keep […]
LikeLike