So yesterday we in the general public were “informed” about 2017 New Mexico PARCC scores. As “explained” in graphics such as the following compiled by the Albuquerque Journal, we have been “informed” that a certain percentage of students in each district have been found to be “proficient” in ELA (English Language Arts) and Math.

And from this, we in the general public are given “analysis” principally from Acting NM Public Education Director Christopher Ruszkowski:
“Ruszkowski pointed to several large districts that saw improvement but acknowledged that APS – with one-quarter of the state’s students at more than 80,000 – had a huge impact on the state’s overall scores.
“No question the largest district is a bellwether of how we are doing,” he told the Journal. “We can’t move forward as a state without our largest district on board.”
That’s it.
Distilling the “information” and “analysis,” New Mexico students are still overwhelmingly failing, and big districts, particularly Albuquerque Public Schools, are driving much of that failure.
Proof? Well just look at the scoreboard! Numbers don’t lie, and New Mexico is on the losing end, thanks to (insert arguments that support one’s position on public schools, teacher unions, “these kids today,” modern American society, immigration, you name it).
And as a so-called professional educator myself, working again in a New Mexico public school, I do get it. I understand the need for a simplistic scoreboard that tells me, Johanna Q. Public, whether New Mexico schools are getting better or not. I, as Johanna, don’t have time to delve into the specifics of how schools are run, or standardized test development, or intervening variables that affect school/test performance.
I, Johanna Q. Public, just wanna know if we still suck or not. And now I “know” that we do.
But is this level of “information” and “analysis” really enough to develop and implement useful educational public policy? Can we delve a bit deeper into the numbers in a way that goes, so to speak, beyond a simple “final score”?
And yes, I am talking here about baseball.
I’m something of a Seattle Mariners fan, so I’ll use last night’s true outlier, a 4-0 shutout of the Boston Red Sox, as my visual example of how we in the general public are willing to go a bit deeper for information in certain topics.
To start let’s show a graphic that generally compares with the graphic from the Journal regarding PARCC scores in New Mexico:

Actually this graphic imparts a bit more information that the PARCC score release. Not only do we find out that Seattle is a “winner” and Boston a “loser,” we also get some specifics in terms of hits and errors, as well as the winning/losing pitcher, a look at their win/loss record to help explain why a shutout outlier might have happened (this Paxton guy is pretty good at 10-3) and the relative win/loss records of the teams involved.
Seriously, as a so-called professional public school educator, I would do metaphorical cartwheels if we could simply elevate the level of information and analysis to this level.
But wait, there’s more. We also get a scoring summary, shorter here because of a 4-0 shutout:

Then we get to find out how each Boston batter did over the night, further explaining the shutout:
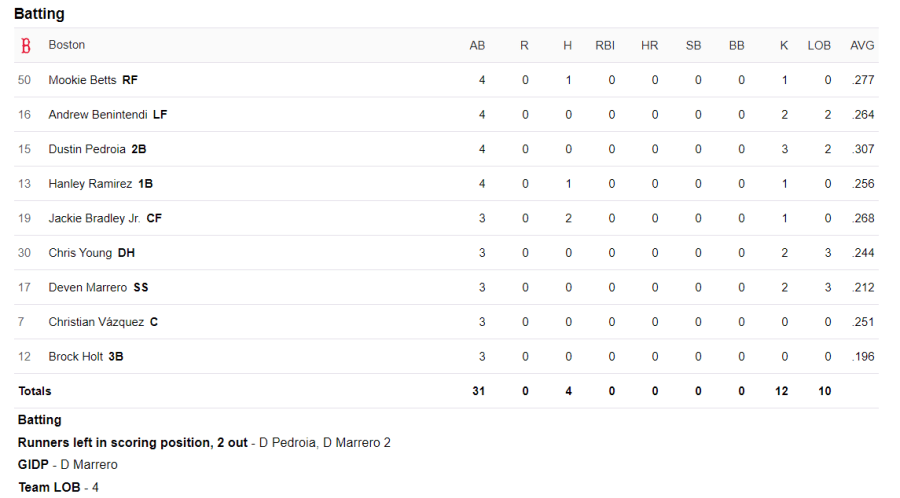
Note we are also told not only that Deven Marrero bats 7th in the Boston line-up, but that he went 0-for-3 and hit into a double play. In other words, we find out quite a bit about how poor a hitting Mr. Marrero might be, information confirmed in the .212 batting average also provided to us.
Naturally, we also get to see how the Mariner batters did:

In fact, we’re told so much about the Mariners that your humble blogger couldn’t fit it all in a screen grab and keep the font size the same. One factoid we can take from the above is that, unlike Boston’s 7th hitter in the order, Seattle’s Ben Gamel hit 7th and was 2-for-3 and scored two runs.
Also interesting, particularly to Mariner fans, is that Mr. Gamel has a .323 batting average for the year, which leads us to perform our own analysis, not found in any analysis done on this “story” by Yahoo Sports, that perhaps Mariner manager Scott Servais is making a mistake, and should move Mr. Marrero higher in the batting order.
Then there’s, of course, pitching data:
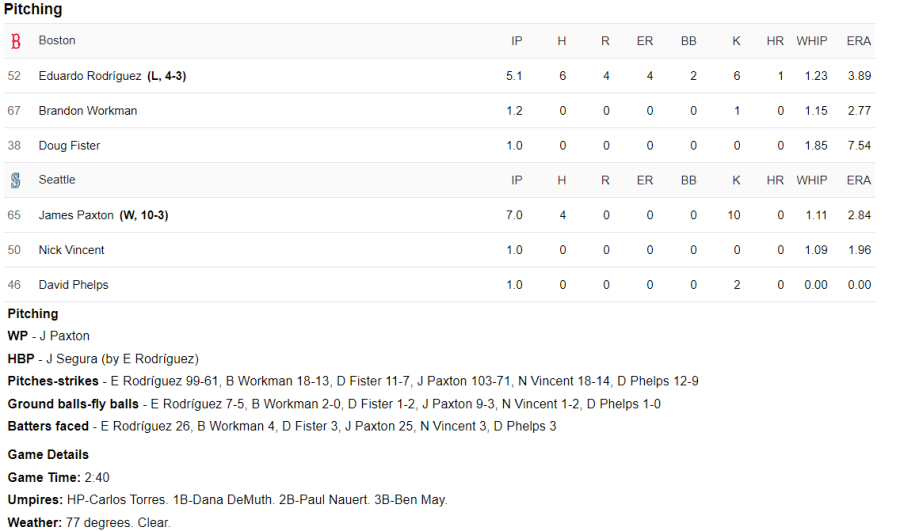
In fact, not only are we told the James Paxton struck out 10 in 7 innings (and 103 pitches) of work, we also find out how long the game lasted, who the umpires were and that it was 77 degrees when the game started.
So by now you’re saying “Enough, already, Scot, enough! We get it! We as a society have established a high statistical bar for sports, particularly baseball, one not shared in areas of public policy, such as K-12 education. We all know that. So what?”
And I get that, too. Each of us in the “professions” knows and is at times/always irritated by the extremely low level of information/analysis delivered to Johanna Q. Public regarding our profession.
But unlike many public policy issues, standardized test scores are a veritable treasure trove of (purportedly) unbiased numerical “scoreboard,” exactly the sort of data we take for granted in a baseball box score. Hell, that’s what test scores are all about: data.
Just to take the smallest, simplest jump in how we can crunch the PARCC numbers is to break down how many students scored in each of the five grading levels, 4 and 5 being deemed “proficient.” Sometimes, news stories do include this part of the “box score,” but notice here it’s not given.
Why is that?
Well, as even Johanna Q. Public knows, the very first news about a subject is what sticks with us most. Follow-up stories, countering op/ed pieces, and even retractions never have the same “informational” impact provided by that first glimpse, even more so the simpler such “information” is relayed.
In this case, the importantly first planted narrative resulting is: New Mexico students are still losers, and public schools here are terrible, especially Albuquerque Public Schools.
Mission accomplished. And from this strong “arguments” for K-12 public policy will be proffered and, likely as not, implemented or perpetuated.
To close my little analogy, let’s go back to the baseball game. As a Seattle Mariners fan, I could use last night 4-0 shutout of Boston as “irrefutable evidence” that Seattle is a great team, that Boston is just a bunch of losers, and that Johanna Q. Public should take off that cap with the big, red “B” on it and wear instead one of the 97 styles of Seattle Mariners cap instead.
Otherwise, Johanna, you’re a loser, too.
And it is not disingenuous to say that PARCC and standardized testing is a very clear attempt to make such simplistic arguments based on data far, far skimpier than the daily baseball box scores. We are all smart enough to keep the adage “Lies, Damn Lies, and Statistics” in mind, but in our busy lives don’t we tend to conveniently forget the adage? Isn’t it keeping us more sane to simplify things and just casually follow the final score and “how ‘our team’ is doing”?
So, yes, I guess I’m ultimately arguing that we as a society become just a bit more insane when it comes to K-12 education. C’mon, I’m a big fan obviously! I’m eager and willing to write overly long, and entirely unpaid, 1,500 word blog posts about it. Repeatedly.
C’mon let’s swap PARCC test data box scores and use that data to really drive educational public policy in a way that truly makes New Mexico students winners! C’mon!
Yeah, as I’ve mentioned, I do get it.

You certainly do get it, and thank you for consistently being a voice of reason during these draconian times.
LikeLike
Thanks Syd! Meanwhile, NMPED just, it appears, posted 2017 1-5 scoring level percentages by district/school/subject in Excel format on its always maddening web site. Here’s a linky: http://ped.state.nm.us/AssessmentAccountability/AcademicGrowth/2017/webfiles/Webfiles%20PARCC%202017.xlsx
LikeLike