
Bicycle and walking counts collected from seven locations along popular multi-use paths around town can now be found at a Mid-Region Council of Governments (MRCOG) website.
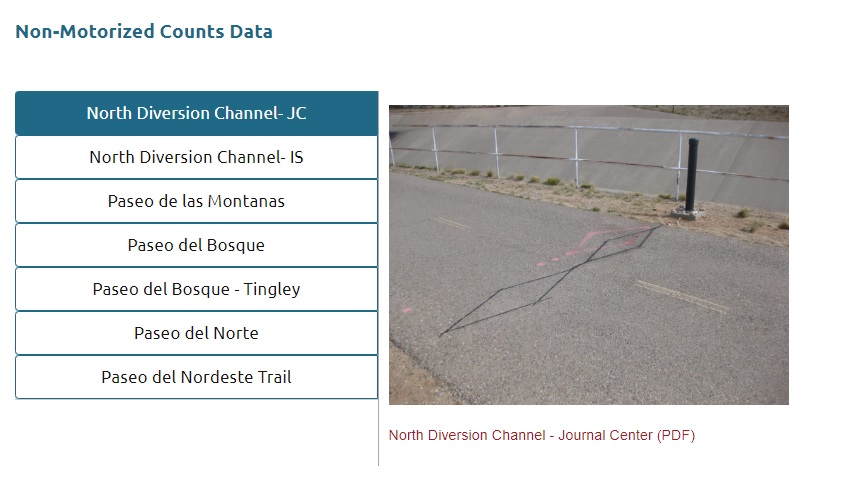
The long-awaited published data goes back monthly to October 2017, providing answers to that eternal question: How many are using this cycling/walking infrastructure? The short answer to the question is: “Lots of folks!,” but there’s still some way to go in terms of presenting the data as a compelling narrative.
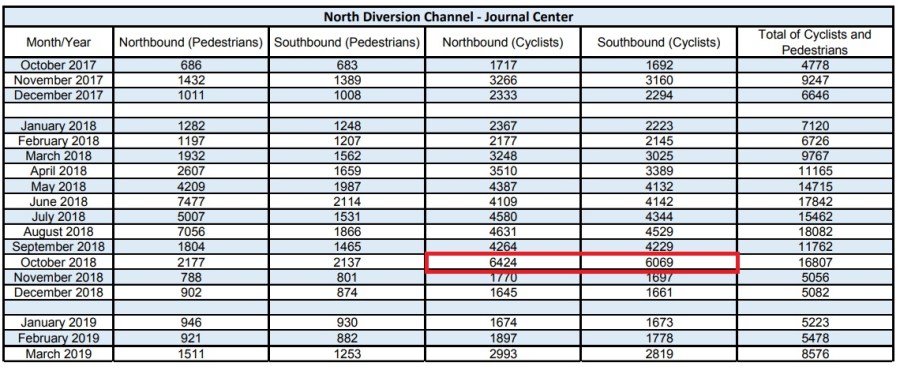
Taking the NDC at Journal Center count as example, we see summer 2018 counts of over 18,000 in August, with over 7,000 walkers northbound twice last year. We also see a pronounced cycling bump in October 2018 that will make excellent information in upcoming City Balloon Fiesta marketing materials and public policy decisions on safety issues such as El Pueblo Road at those infamous train tracks.
The biggest limitation in telling our cycling/walking story through this information currently is that it’s being presented as dated, monthly figures, instead of live, daily counts with cumulative numbers, such as Seattle does at three of its many bike count locations.

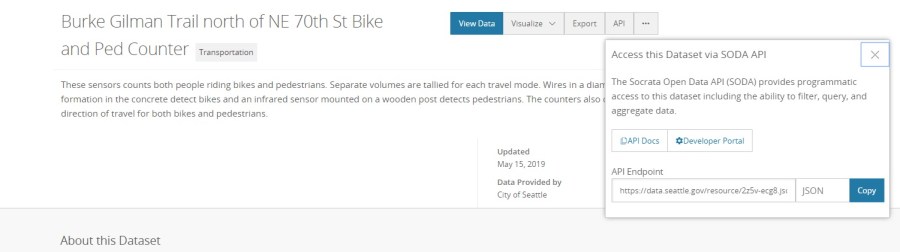
Seattle also does something desperately needed here in terms of open sourcing the data. Here’s a look at one of the Emerald City’s hourly, yes, I wrote “hourly,” counters along the much-traveled Burke Gilman Trail there:
Cycling/walking data will be interesting and policy-changing when MRCOG and other local/state government entities elevate their collection and display of such data to the point that users, advocates, and public policy decision-makers can quickly gather, understand, and interpret the numbers. Current limitations in staff capacity (i.e., funding) is making that leap difficult at present, and our current discussion of Vision Zero pledges and Complete Streets renewals/revisions need to include consideration of sufficient funding in this regard.
Without the means to adequately, quickly collect/publish cycling/walking counts and make those counts freely available to researchers, advocates and others seeking to argue for/against funding for bike/ped improvements, we’re left with only .pdf tables of monthly counts that require those interested to inadequately “dress up” with little red boxes as seen above.
That said, those NDC at Journal Center October 2017 numbers do start to tell a very compelling story. Better storytelling tools (GIS maps, etc.) and more frequent plot lines (data points) will really make that narrative “pop.”
