Been staring a bit at the endlessly fascinating counts found on MRCOG’s historic traffic flow maps for Greater Albuquerque that go back all the way to 1968. Now that enough time has passed, I thought it might be interesting to compare pre/post-Albuquerque Rapid Transit (ART) counts on Central Ave in stretches heavily altered in terms of roadway engineering.
Here’s what shows up comparing the 2017 and 2022 counts for the stretch between University and Louisiana, using 2022 as the most post-Covid data we have at present.

It takes a minute of staring to get oriented (okay, I’ll give you a minute; take your time), but what we’re seeing here are counts for Central and nearby streets/stroads. Lots to tease out from the numbers above, but perhaps most striking is the very sharp drop of vehicles daily on Central throughout this stretch.
Taking just one data point, the drop from Washington to San Mateo is 46%, and the plummet stays pretty much right around that extent throughout, lowering a bit to 33% between San Pedro and Louisiana.
What does it mean and where did the drivers go?
The natural inclination is to assume they must have gone to nearby parallel streets/stroads, but numbers on Lead/Coal have also dropped quite a bit, and those on Lomas have generally dropped a bit or remained steady.
So where are these people?
I’d love to say that, for instance, 11,100 folks who formerly drove Central daily between Carlisle and Washington are now walking, cycling, or taking the bus instead, but, no, that’s not happening.
I’d also really love to say that the drop on Central has occurred because of the driver-discouraging and walking/rolling-encouraging engineering put in place via ART, but the drop is widespread. Heck, even Gibson has fewer drivers on it these days.
Chatting with a few local government agency folks, there doesn’t seem to be definitive agreement on exactly what is causing this. Nationwide, vehicle miles traveled has roughly 100% returned to pre-Covid levels.
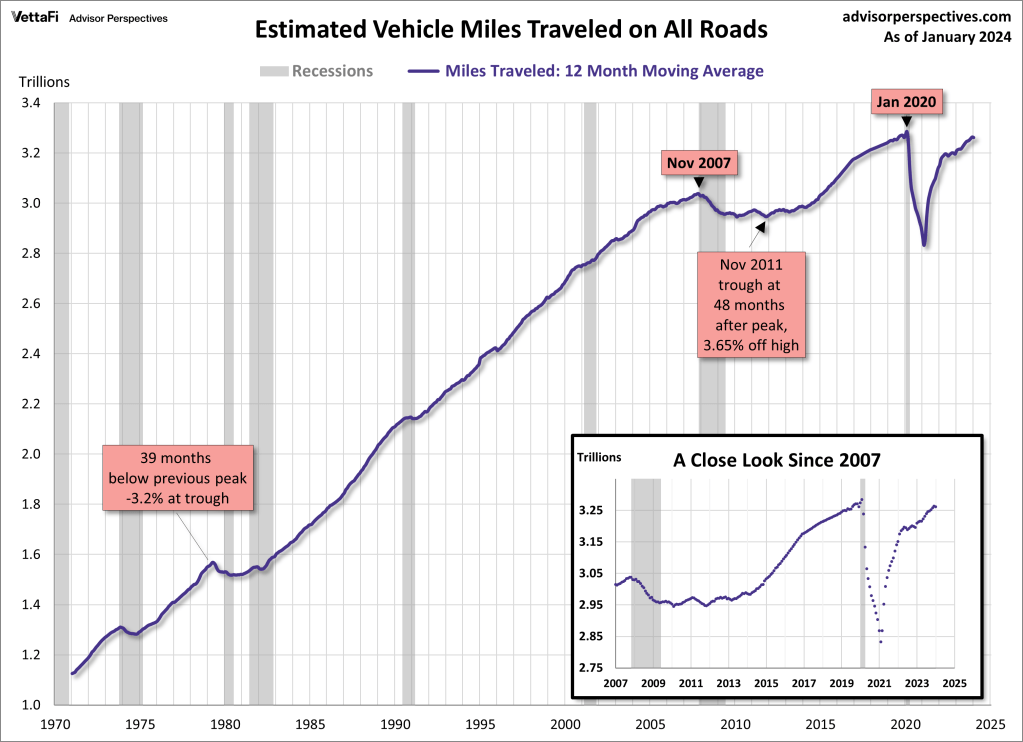
Chronologically consistent with the MRCOG numbers above, the Federal Highway Administration estimated a 3% post-Covid drop in nationwide vehicle miles traveled remained in 2022. That’s not 46%.
The most confident, but still far from certain hypothesis is that significant enough numbers of folks are still working remote or hybrid to cause something approaching such a drop in urban driving. For comparison, I’m digging through Denver’s far snazzier Council of Governments interactive map of traffic counts, but can’t figure out the snazzy quite enough yet to find year-by-year counts on, say, Speer Blvd. Readers are highly encouraged to try finding such numbers and passing them along.
The drop in numbers of folks driving is unfortunately not leading to a concommitant reduction in traffic crashes and fatalities. The folks at UNM’s Geopolitical and Population Studies, repository for such data in the state, haven’t gotten around to a 2022 Crash Report quite yet (because heck, it’s only 15 months after 2022 ended), but even the 2021 figures show crashes rebounding to near pre-Covid levels. NM crash fatalities did drop significantly in 2023 from 2022, but were still higher (406) than 2017 (380).
Even harder to quantify, and equally important, is a follow-up question: How many walkers and rollers have been kept alive from the engineering changes on that ART-stretch of Central from University east to Louisiana? We’ll further dwell on that and other questions raised above in our next post looking at Central Avenue east from Louisiana to Tramway.
