You can learn and/or remember a lot regarding the last half-century of Albuquerque transportation from looking at the New Mexico Region of Governments (MRCOG) repository of “Traffic Flow Maps” from 1968-2018.
Every year, a map of traffic counts is put together, and the site collects these maps in an easy-to-view, fast-loading list/folder. One imagines that if MRCOG were”Wallethub” or another of those icky ranking listicle operations, these maps would be spread over 97 clicks and 197 ads. Having a fast, easy list is so socialistically refreshing.
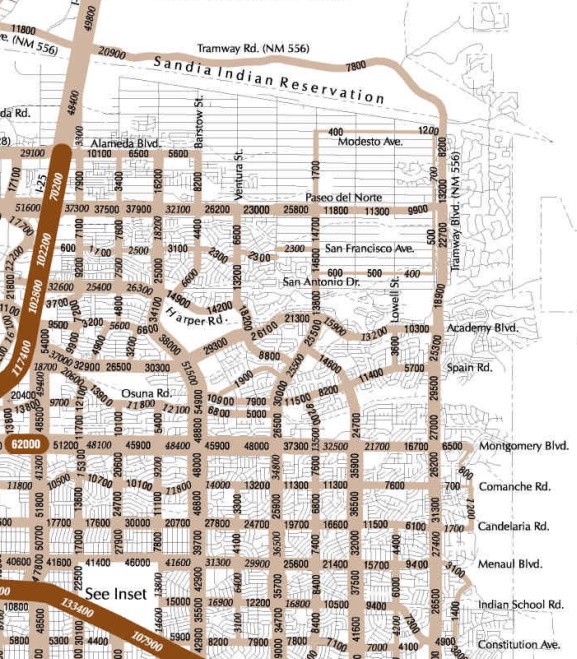
And the maps and traffic figure counts are historically insightful and thought-provoking. Focusing on the NE Heights, what if the current U.S./ABQ trend toward “road dieting” (i.e., lane reductions, wider bike lanes, etc.) roads with under ~12,000 vehicles per day had been in full-gear back in 1970? Those and many other questions crop up as we move from 1970 to 2001.
Northeast Heights 1970

Northeast Heights 1985

Northeast Heights 2001
Coors Blvd. and the Westside
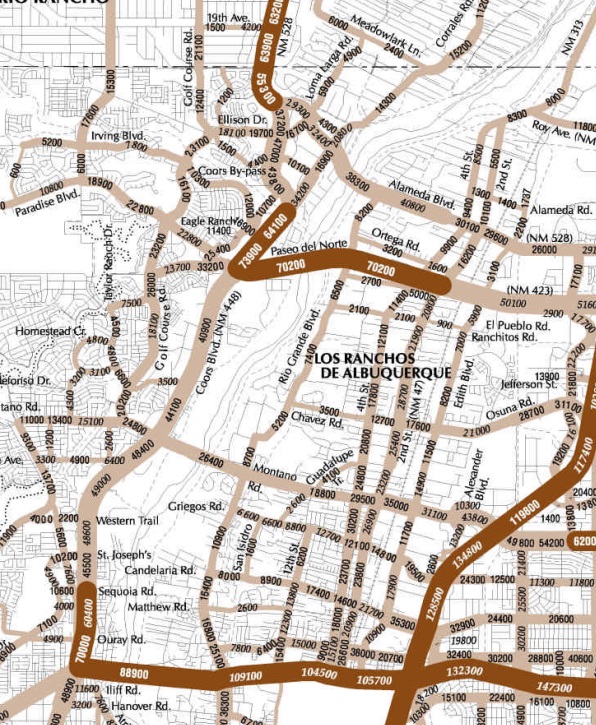
As for the following three map excerpts, its story of new bridges and sprawl is more well-known. Nevertheless, it’s still fun to consider a world in which those bridges had never been built and almost all the folks living/driving on Coors instead lived/transited/bike/walked/drove in a much higher density Albuquerque largely contained east of the Rio Grande River.
Coors 1970
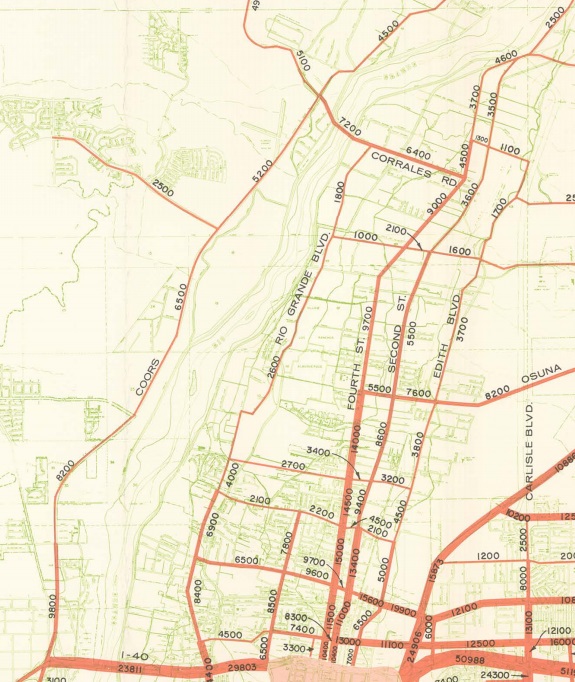
Coors 1985
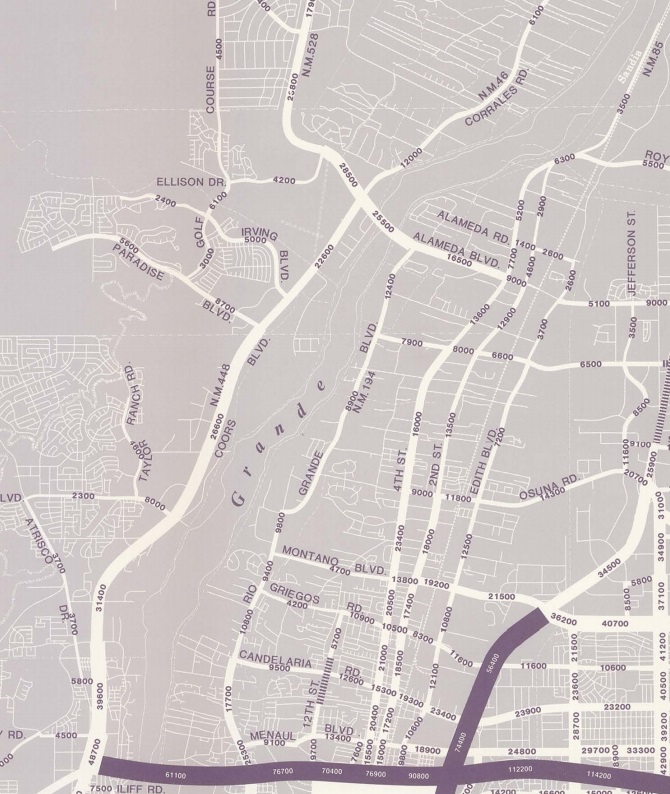
Coors 2001
Oh well, maybe next time we’ll think road diets earlier and that maybe quality of life has an inverse relationship with sprawl.
Have a great weekend, everybody!
