
Catching up on our look at how traffic patterns have changed due to Albuquerque Rapid Transit (A.R.T.) construction and its, temporarily, aborted grand opening, we’ve looked at Central Avenue and Lead/Coal/Zuni.
The general findings there are that driving is down significantly on Central and up only somewhat on Lead/Coal/Zuni (although if you read the comments you’ll see there is definitely concern regarding A.R.T.’s impact on L/C/Z ). So the question is: How are drivers instead going East/West on roads/stroads/highways running parallel to Central?
Making the grand assumption that thousands of drivers are not riding bicycles/walking instead, and knowing transit ridership has continued to plummet, even before COVID-19, it figures a check of Gibson Blvd., L/C/Z, Lomas, Constitution, Indian School, I-40, and maybe Menaul should reveal increases on those roadways making up the thousands lost on Central.
And that might be exactly what has happened, but shortcomings in data collection make confirmation of this impossible. For instance, we do see a 12% increase in traffic count on Lomas basically east of University, but there are too few counts/data points and those counts don’t match well with a truly pre/post A.R.T. timeline. The same goes for other parallel streets.
MRCOG, the primary governmental counting aggregator in the area, has more meaningful annual counts available via its “TAQA” (Transportation Analysis and Querying Application) and online “interactive map,” but neither currently has 2019 counts. MRCOG’s other ongoing counting is every three years, with different rotation dates for different locations. So some stretches have 2015/2018 data and others 2016/2019.
Ergo, the data is generally not recent and thorough enough to tell us much of anything. Which gets us to my cycling buddy (pre-COVID, these days we’re just riding solo) John.
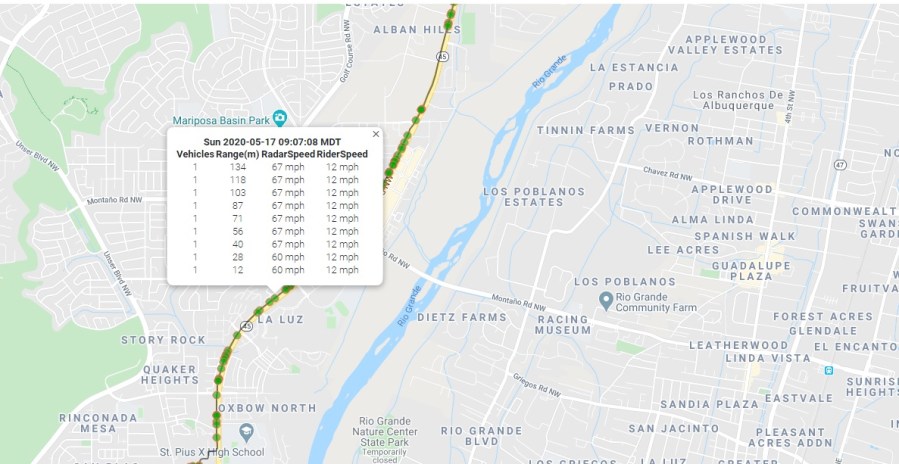
I hear/tell riding buddy John now has one of those new-fangled Garmin “Varia” radar lights that detects approaching vehicles.

These units also store information on the number of vehicles approaching at any one time and, in some fashion, the speed of the approaching vehicle. What if somebody created an app that took that stored data and aggregated it so riders could have fun seeing how many vehicles approached them and how fast those drivers were going?
As you fully expect, somebody (actually more than one somebody) has already created such an app. Another somebody has already making it possible to pair that data with the very popular training app Strava.
Do you see where we’re going here in terms of instantly compiled open source traffic counts and speed data?
We’ll wait a second for you to think about if you don’t see where we’re going quite yet.
Still waiting.
So instead of those rubber hoses you see every once in a while across streets counting tires, what if one took a Garmin “Varia” (no product endorsement from BB whatsoever) and, say, put it on a lightpole on Coors at Rio Bravo? As the Varia needs a Garmin bike computer to throw data at, what if we found the maximum distance said computer can be located from the “Varia” and placed it there (in a safe, secure location..those things are expensive!)?
What we’d have as a result is the transportation equivalent to the famed Shimmer, the amazing product that is a “desert topping AND a floor wax!” In this case, a live radar traffic counter AND speed gun! Isn’t open source fun? Way more fun than…well, let’s close on the not quite so fun, but far more likely to happen part.
A very much not open source firm, Streetlight Data (“Big Data for Mobility”) is offering a ton of very recent data (traffic counts, speed, vehicle miles traveled, bike/ped counts, etc.) through its mix of proprietary collection methods to gather info from smartphones and vehicle GPS units. In a sure sign this aggregated information ain’t cheap, one is instructed to “contact Streetlight for a quote.”
Whether open source or pricey, or both, very soon traffic counts will not be done via little rubber tubes strung across roadways. The implications of such data being made available much more quickly could be far reaching.
To take one example, anyone in Albuquerque pushing for a lane reduction “road diet” to make things safer for all users is currently always told such a “diet” can only follow a costly “traffic study” that includes counts performed with little rubber tubes, etc. Implementing some, hopefully not costly, version of insta-counting would potentially speed up the formal “road dieting” process immensely.
In conclusion, these are exciting days in the world of roadway traffic counts, but you wouldn’t know it from looking at the count information currently available. It’s a little thing, but one small step toward that exciting new future would be for Garmin to sponsor Better Burque with a free “Varia” and one of their newer model bike computers.
You know, for Science.
Have a great weekend, everybody. Stay away from riding Coors Blvd. (see speed data in graphic above).
