
The Mid-Region Council of Governments (MRCOG) has processed recently finalized 2017 information from the NM Department of Transportation on fatalities for those trying to walk our roadways that year. Statistics and visuals related to this information are now available at the April edition of “Travel Times,” that little-known, yet info-packed online publication from MRCOG and Mid-Region Metropolitan Planning Organization (MRMPO).
The short report is overflowing with insightful stats and graphics. Focusing on the Albuquerque Metropolitan Planning Area (AMPA…yes, I know so, so, so many acronyms), MRCOG researchers find the following:
- 30 out of 36 (83%) of the pedestrian fatalities in the AMPA occurred on principal arterials
- 4 occurred on minor arterials and 2 occurred on the interstate
- 34 of the 36 fatalities (94%) happened on 4-lane or larger roads
- All fatalities were on roadways with a speed limit of 35 mph or higher
- 12 of the 36 fatalities happened at an intersection
- 18 of the 36 (50%) fatalities happened over 600 ft from the nearest crosswalk
- 21 of 36 (58%) were classed as “Alcohol/Drug Involved” crashes (it is unclear in this dataset whether the pedestrian or the driver was under the influence)
- 7 out of the 36 fatalities occurred during daylight and did not involve drugs or alcohol
- 12 fatalities occurred at night in areas without streetlights
- 13 of 36 happened at night but in areas lit by streetlights
- 31 of the 36 deaths (86%) occurred on roadways directly abutting high poverty areas as indicated on MRMPO’s Equity Index.
Moreover, and perhaps most captivating for those of us seeking to reverse this deadly trend, below is a map pinpointing 2017 walking deaths and the “Equity Index,” a neighborhood/census tract breakdown that “integrates minority and low income populations” and displays level of inequity from 1-10, with higher numbers reflecting greater inequity.
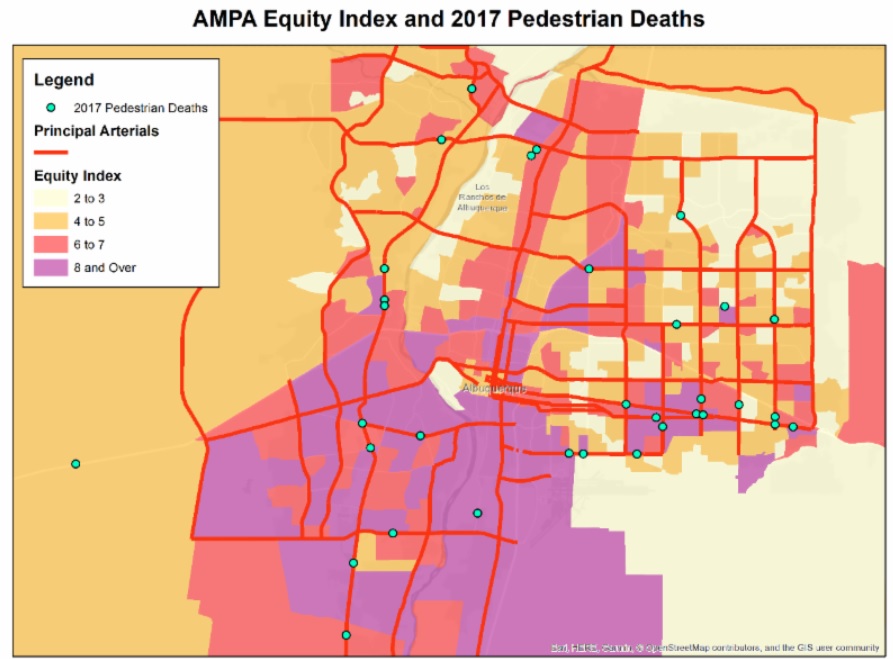
Look at the dots.
Look at the red and purple.
Look at the legend.
Dots. Red and purple. Dots. Red and purple.
Any questions?
The correlation between high walking fatalities and low-income and/or minority areas is unmistakable. It’s something BernCo Commissioner Steven Michael Quezada brought up when talking Coors Boulevard’s dangers in the South Valley a week or so ago. Many, particularly those in the field and in political office, know this, but little is being done. Reasons are many, of course, but the problem’s core is that very real lingering socio-political reality still thwarting true equality: Whites with money getting better stuff than people of color with no money.
From this maxim of inequality come arguments to defend positions (and stuff). One common response to displays illustrating the correlation of inequity and walking deaths is “Sure, there are more deaths there because there’s more pedestrian activity.” While accurate pedestrian counts are maddeningly hard to gather, assuming this is correct, one’s reply might be: “Okay, if that’s true, shouldn’t the walking infrastructure be far safer in those areas? Much more safer than in areas with fewer pedestrians?”
Instead, the opposite is true just about 100% of the time.
Looking again at the dots and red/purple above, note the stretch of Central east toward Tramway Boulevard. Distances between signalized crosswalks there are up to thousands of feet. Same for Coors Blvd. in the dot-filled South Valley. Lighting is worse and posted traffic speeds high. There are more and more reasons (restaurants, convenience stores, etc.) to walk in these underserved, minority/low-income areas, yet walking infrastructure in the red/purple areas above are the worst in the city.
While this fact is more and more widely known, perhaps the power of visually portraying this fact via graphics such as that above will best help folks “get it,” particularly folks who have the power to truly fix the situation.
Thanks to staff at the acronymed-filled MRCOG/MRMPO for putting this information together. Readers are encouraged to read and see more regarding the 2017 figures at “Travel Times.”
Have a great weekend, everybody. Walk safe out there, regardless of where in town you do so.

[…] more geographically political (i.e., City Council District) than accurate in terms of the problem. As outlined in an April post here, the Mid-Region Council of Governments (MRCOG) looked at all 2017 walking deaths, and created the […]
LikeLike